Teacher's Guide
A Teacher's Guide for
The Choice: A Fable of Free Trade and Protectionism
by Russell Robert
(See also: Questions for Students
By Lisa McNary, LaGrange College)

In these notes, I lay out the graphical analysis of tariffs and quotas when the U.S. is a price taker in world markets. At the end of this material are some exam/homework questions that maybe of interest. Eventually I would like to add other material of my own as well as questions other teachers might use when they teach The Choice in their classrooms.
Derivation of Supply and Demand Curves for the International Market
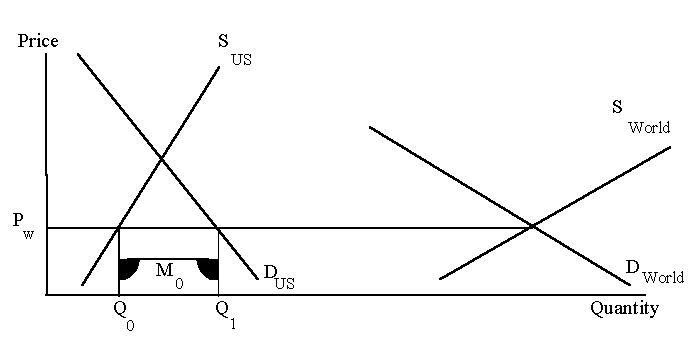
I begin with the concept of equilibrium in the market for pairs of shoes of a particular quality. World supply and demand determine the world price, PW. For what follows, the U.S. is assumed to be a price taker, and the U.S. supply curve is upward-sloping, rather than horizontal. (For some products and some countries this assumption is fine, for others not so fine. I consider an alternative case below.) I begin with the case where the world price is below the intersection of the U.S. supply and demand curves. I'll consider the other possibility in turn.
The world's supply and demand curves are the horizontal sum of the supply and demand curves of individual countries. This is the same process as deriving the demand curve by horizontally summing the demand curves of each individual in the market.
Shoes of this particular quality (say men's leather dress shoes of a particular level of comfort, stylishness and quality of leather) will sell around the world for $80 (so PW=$80). Of course in Greece their price will be denoted in drachmas and in Israel the price will be measured in shekels. I ignore the issues of exchange rates and foreign currency by invoking the law of one price. If shoes sold in Israel for some number of shekels that was higher than $80, people would import shoes from elsewhere where the price was lower, increasing the supply and lowering the price in Israel. This arbitrage opportunity would exist as long as the price in shekels exceeds $80. Either the price of the shoes measured in shekels or the exchange rate between shekels and dollars will adjust until the price in Israel is equivalent to $80. This allows me to talk about one price measured in dollars. If your class focuses on issues of exchange rate determination, this would be more than a brief digression.
I also ignore transportation costs on the grounds that they are fairly small for many goods. Introducing transportation costs only causes the law of one price to adjust by the amount of the transportation cost without affecting any of the substance of what follows.
Now let's look at the U.S. supply and demand curves. At the world price of $80 there is excess demand in the United States. This excess demand would usually work to increase price in the United States until price was where the S and D curves intersect. But it does not happen when the market is international because as soon as the U.S. price is above the world price of $80, everyone wants to sell shoes in the United States. The increase in supply forces the U.S. price back down to $80.
The excess demand in the U.S. at the world price of $80 is eliminated by imports of amount M0. There are two points to make here. The first concerns the role of arbitrage. Here is a homework question: if the demand for chicken wings in Buffalo exceeds the demand for chicken wings in Peoria, then chicken wings will be more expensive in Buffalo. The obvious answer is yes. But the obvious answer is wrong. The individual intersections of supply and demand in Peoria and Buffalo say nothing about the prices in the two places. They are part of a national (or international) market for chicken wings. Because wings can be transported around the country, the law of one price kicks in. If price is higher in Buffalo then people will "export" wings to Buffalo. By the same logic, I don't pay more for chicken wings even if I walk into my local grocery and announce that I crave wings and intend to eat them every night. My demand greatly exceeds my supply, but transactions take place in a larger market context that determines price.
The second point to make is that not every nation in the world can look like the U.S. in the graph. Not every nation can be an importer. If they all wanted to import, then the price would rise, discouraging consumption and encouraging production, and some nations would find the world price to be above where their supply and demand curves intersect. For those countries there is excess supply at the world price. Rather than drive price down, this creates exports.
The Effect of a Tariff
A common trade restriction used by countries around the world is a tariff. A tariff is a fee that must be paid by exporters to the government whose country is doing the importing. Tariffs are often denoted in terms of a percentage of the selling price. For simplicity I will look at a tariff that is a fixed per unit amount.
What is the new U.S. equilibrium when there is a tariff of $10 placed on every pair of shoes imported to the U.S.? Price can no longer be $80. If it were, foreigners would only be receiving $70 after they have to pay the tariff. They will prefer to sell shoes elsewhere where they can earn $80 and not pay a tariff. We maintain the assumption that the U.S. is a small part of the world market, so foreign shoe sellers will be able to divert sales to countries outside of the U.S. without having a significant effect on the world price.
In the U.S., if price were to stay at $80, there would be excess demand. This drives price up in the United States. How far will price go up? It will have to go up to $90. At any price above $90, there will be excess demand. At prices above $90, foreigners earn more than $80 after paying the $10 tariff. Supply will exceed demand, driving price down to $90. Only at $90 does quantity supplied equal quantity demanded.
So the equilibrium price in the U.S. is $90. It is important to remember that the price of both foreign shoes and shoes made in the U.S. will be $90. Even though there is no tax or tariff on U.S. shoes, their price will rise because of the law of one price. Another way to think of this effect is that the tariff initially drives up the price of foreign shoes, creating excess demand for U.S. shoes. In equilibrium, both kinds of shoes must sell for the same price. This is due to the assumption that they are of equal quality. (An exception to this result is when the U.S. supply and demand curve cross at a price less than $90. Then the price will rise to the intersection of U.S. supply and demand.)
The effect that a tariff has on the price of domestically produced shoes is surprising and it is what stuns Ed on page 44 of the book. Dave explains in layman's terms what the previous paragraphs explains through slightly more technical analysis.
"Perhaps it seems unfair. But consider the alternative. Suppose the American manufacturer does not increase his price. What will happen?"
"He will make the same amount per television that he made before. Seems fair."
"But if he makes the same amount per television as he made before, will he expand output or keep it the unchanged?"
"Keep it unchanged. You're not going to open a new factory and expand your capacity without a higher price. You would have already opened all the factories that would be profitable at the old price.
"Exactly. But while domestic television production is unchanged, Americans want more domestic televisions than they did before because of the price increase of foreign-made televisions. Too many consumers are chasing too few televisions."

A tariff on imported shoes has the following effects:
- 1.
U.S. shoe consumption decreases from Q1 to Q2.
The tariff causes the price in the U.S. to rise. U.S. consumers move along their demand curves.
- 2.
U.S. shoe production increases from Q0 to Q3.
The tariff causes the price in the U.S. to rise. U.S. producers move along their supply curves.
- 3.
Imports fall from M0 to M1.
Imports close the gap between quantity demanded and quantity supplied at the market price. That gap is smaller at a price of $90, so imports fall. Students often wonder why imports have to fall. They see that total quantity has to be smaller because quantity demanded has fallen. But why can't imports stay constant and the entire decrease in quantity come from domestic production? If imports stayed constant there would be excess supply at $90. This would drive price down. If price falls below $90, all of the imports leave because they can do better elsewhere, but U.S. supply would only fall a little as domestic suppliers move along their supply curves. This is the reason why imports are essentially determined by the size of excess demand at the market price and do not have a life of their own.
What happens to the sales of shoes that used to go to the U.S. but are no longer sold here? They go elsewhere. By the assumption that the U.S. is a price-taker, those sales get spread around the world without affecting the world price in a significant way. It is equivalent to assuming that if I were the biggest apple-eater in St. Louis and stopped eating apples, the price of apples in the world or in the U.S. or in St. Louis would not go down. The apples I used to eat would get reallocated to others with a negligible effect on prices. On the other hand, if the U.S. were a significant part of world demand, then this reduction of sales in the U.S. and reallocation of the M0-M1 sales to others would drive price down around the world as exporters tried to make sales elsewhere. I consider this case below.
- 4.
Government revenue increases by $10 × M1.
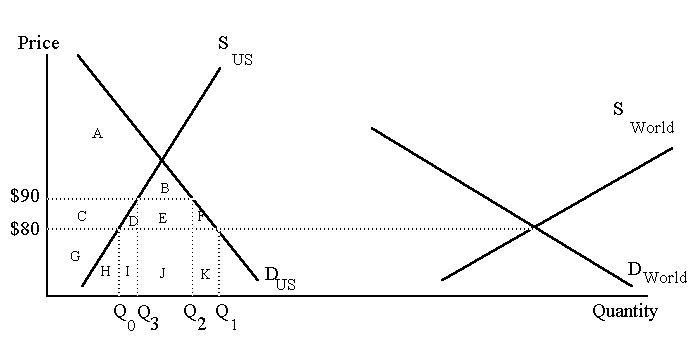
Tariff revenue is shown below as the box E, the box with height $10 and width equal to M1.

(The next three results deal with welfare costs. The full analysis requires a knowledge that areas under supply curves represent real resource costs and areas under demand curves represent willingness-to-pay, a measure of value. If you do not cover these topics in your course, I also provide intuition taken from the book that does not require this level of detail. If you do cover this material, the book gives extra intuition.)
- 5.
Profits of domestic suppliers increase.
Before the tariff, total revenue of U.S. suppliers was G+H. Costs were the area under the U.S. supply curve, H. So profits before the tariff were G. After the tariff, revenues are C+D+G+H+I. Costs are H+I+D. So profits are C+G. Profits have increased by C.
- 6.
Consumers are worse off.
Before the tariff, consumers consumed Q1 shoes. The value of those shoes was the area under the demand curve, A+B+C+D+E+F+G+H+I+J+K. Consumers had to pay $80 for each pair of shoes. Their total expenditure, paid to foreign and domestic suppliers was G+H+I+J+K, leaving consumer surplus of A+B+C+D+E+F. After the tariff, consumers only have Q2 shoes to enjoy. Total value of those shoes, the area under the demand curve, is A+B+C+D+E+G+H+I+J. Consumer pay $90 for each pair of shoes for total expenditure of C+D+E+G+H+I+J, leaving consumer surplus of A+B. Consumers have lost the wedge C+D+E+F due to the higher prices. It is useful to divide this loss into two pieces. C+D+E and F. F is lost because fewer shoes, Q1-Q2 fewer, are enjoyed. These lost shoes had a value of F+K. K is expenditures freed up to spend on something else, so the net loss is only F. C+D+E is lost because for the shoes that consumers still consume, they must pay a higher price and this also makes them worse off.
- 7.
There is a net loss to society of D and F.
This loss is alternatively called waste or dead-weight loss. I usually derive this in a number of ways to help students get the intuition within the graph. The first way compares net value (total value minus total cost) before the tariff to net value after the tariff.
Total Value
Pre-tariff A+B+C+D+E+F+G+H+I+J+K
Post-tariff A+B+C+D+E+G+H+I+J
Total Cost
H+I+J+K
D+H+I+J
Net value
A+B+C+D+E+F+G
A+B+C+E+G
The change in net value due to the tariff is a decrease of D and F. They measure the loss to society from the tariff, measured in dollars.
The tricky part of chart is the total cost before and after the tariff. Before the tariff, consumers pay $80 for shoes. But this does not represent the real resource cost to America of the shoes that are consumed. Before the tariff, America enjoyed Q1 shoes. These shoes came from two sources, domestic and foreign. The cost of the Q0 domestic shoes was the area under the U.S. supply curve between 0 and Q0, or H. Before the tariff, Q1-Q0 shoes were imported. What is the value of the resources America had to give up to "produce" these shoes outside of America? Consumers gave foreign producers $80 for each pair of shoes produced, for a total of I+J+K. This looks like it's just money, not real resources. But those dollars are claims on American resources. American consumers send I+J+K dollars worth of purchasing power to non-Americans.
The cost of I+J+K for imports embodies the argument behind the roundabout way to wealth. There are two ways to make shoes. The first is to open a shoe factory and take leather and machines and people and make shoes the direct way. The second way is the roundabout way. Instead of making shoes, we make something that Brazilians want, for example, and swap this product for shoes. That is what is really going on in the picture. Americans are swapping $80 worth of goods to Brazilians and other people in return for shoes.
After the tariff, America enjoys Q2 shoes. What are the real resource costs of these shoes? Q3 shoes are produced domestically. Their cost is the area under the supply curve, or D+H+I. Q2-Q3 shoes are imported. Americans pay foreigners $90 for each pair of shoes, leading to the tempting conclusion that the real costs of the new level of imports is J+E. But you have to remember the $10 tariff. Even though $90 is paid by consumers, only $80 of that goes to the foreign producer. Ten dollars of the $90 stays in the country in the form of tariff revenue to the government. This $10 is a transfer, not a real resource cost. It is a transfer from consumers of shoes to whomever the government spends the tariff revenue on.
To see what D and F represent, it's easiest to look at the waste from a different angle by looking at the marginal changes in quantity the tariff causes. The tariff causes consumers to have fewer shoes, reducing consumption from Q1 to Q2. These lost shoes have a value equal to the area under the demand curve. So consumers lose F+K of enjoyment from the shoes. But not buying shoes frees up expenditures to be made on other less valuable items. Consumers used to spend K on the shoes. This is the amount freed up to have more of something else. So the net loss is only F.
On page 47 of the book Dave offers Ed an explanation of why triangle F is loss in the case of a $25 tariff on $250 televisions.
The triangle D is the cost of ignoring the full virtue of the roundabout way to wealth. Notice that after the tariff American shoes at the margin, cost the same as foreign shoes, or $90. I emphasize at the margin, because in equilibrium, the last pair of American shoes and imported shoes must have the same cost if both American and foreign shoes are sold in equilibrium. This is why it is so misleading to look at the costs in equilibrium and make conclusions about quantities different from the equilibrium. It would be terribly incorrect to look at the figure and conclude that when American production is at Q3 and "costs" are equal, that if imports were totally eliminated, then it wouldn't cost America more to produce those shoes domestically than to import them.
One more way to see the impact of the tariff on society is to look at the effects on producer surplus, consumer surplus, and government revenue. Consumer surplus falls from A+B+C+D+E+F to A+B. So consumers lose C+D+E+F. Producers gain C, the government gains E, so D and F are lost consumer surplus that no one regains.
The Effect of a Quota
Quotas are also used to restrict trade between countries. There are two types of quotas. The first is a standard quota in which the country wishing to limit the amount of foreign products coming into its markets issues licenses to importers allowing them to import only certain amounts of the good or service to be limited. Any foreign producer who does not have a license cannot import the good and those with a license are restricted to a certain level of imports. The second type of quota is a "voluntary" quota. A voluntary quota is put into effect by the country wishing to limit imports simply by requesting that foreign producers limit their shipments to a specified level. The foreign suppliers comply without any laws being enacted to limit their shipments.
Quotas can be set to mimic all of the price and quantity effects of a tariff. In the case of a $10 tariff, imports fell to M1 from M0. A quota set at M0 will be virtually identical to a $10 tariff. To see this, let's look at how the equilibrium in the American shoe market will be affected by the quota of M0. Start with the free-trade equilibrium, with U.S. consumers buying Q1 pairs of shoes, and U.S. suppliers producing Q0 pairs of shoes. Price in the U.S. is the world price of $80.
Now the government establishes a quota, only allowing M0 shoes to be imported. What is the effect on price and quantity? The new equilibrium price will be established where quantity supplied in the U.S. is equal to quantity demanded. Where will this occur? Price can't stay at $80. At $80, quantity demanded is Q1. We know that foreigners will sell shoes in the United States as long as price is $80 or greater. So at the price of $80 there will be people willing to sell shoes in the United States but only M0 shoes are allowed to come in. So quantity supplied to the U.S. when price is $80 will be Q0 plus M0, shown as Q0' below. The solid line at the price of $80 is the horizontal distance M0 added to Q0 of U.S. production to get the total quantity supplied to the U.S. by both domestic and foreign suppliers of Q0'.
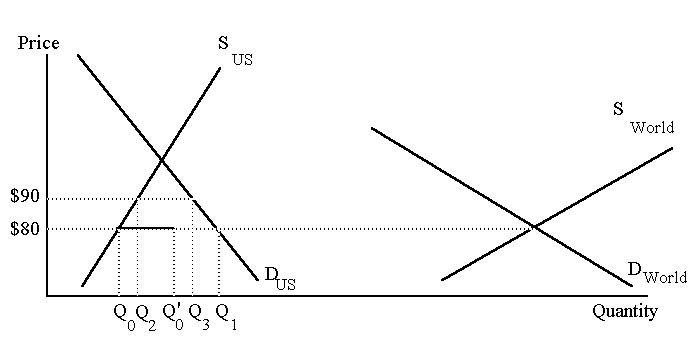
So there is excess demand at $80, driving price up. To find the new equilibrium price, you have to find a place where there is a horizontal distance of M0 between the U.S. supply and demand curves. Only at this place will quantity supplied equal quantity demanded. But we know where this occurs, by construction. We know that at a price of $90, quantity demanded exceeds the U.S. quantity supplied by M0. We know this from observation of the effect of a $10 tariff.
So a quota of the amount M0 will drive price up to $90. The quantity effects are also the same: U.S. consumption falls, U.S. production expands but not enough to make up for the reduction in imports. The only difference between a tariff and a quota in this static analysis is that under a quota, the foreign suppliers get the higher price of $90 per unit and therefore E, which represented tariff revenue, is now lost. So the waste from a quota is D+E+F rather than just D and F. This is the loss to the United States. From the world's perspective, the area E still represents a transfer.
A voluntary quota works in a similar fashion. However, a voluntary quota usually applies only to a specific country. It also raises the question of how the foreign government achieves the necessary reduction, an issue that also arises with a standard quota. On page 57 of the book, Dave explains to Ed how the type of quota used determines who controls, and therefore benefits from, these decisions.
EXERCISES
1. "Suppose the U.S. supply and demand curves for shoes intersect at $85 and the world price is $80. Then a $10 tariff will drive the price in the U.S. up to $95 and make the U.S. an exporter of shoes." Is the preceding scenario true, false or uncertain, and why?
2. Consider a world of no tariffs or quotas on cars. Suppose the world price for a small fuel efficient car is $8,000. Suppose that in equilibrium, sales in the U.S. of small fuel efficient cars are 1,000,000 with half being produced domestically and half being imported.
B. Now suppose the government bans all imports. Illustrate and describe the new equilibrium.
C. Assign a sensible numerical value for the new price when there are no imports. If you knew the elasticity of demand, how could you determine the equilibrium sale of cars in the United States without imports?
B. Now suppose that in fact producers outside of the United States do not discover an improved technology, but lower the price to $10,000, anyway, a price below their cost. (In other words, they begin dumping.) How would your analysis change?
Now suppose that a flood in the Midwest destroys much U.S. grain. Illustrate and describe the new equilibrium in the United States caused by the flood. What is the equilibrium effect of the flood on A) the quantity supplied by U.S. suppliers, B) the quantity demanded by U.S. consumers, C) exports, and D) the price of grain in the United States?